Key Facts & Figures About Collegiate Play
$12,800 Average cost of one year at an in-state public school
$19,000 Average cost of one year at an out-of-state public school
$27,800 Average cost of one year at a private college
$10,500 Average cost of one year at a two-year community college
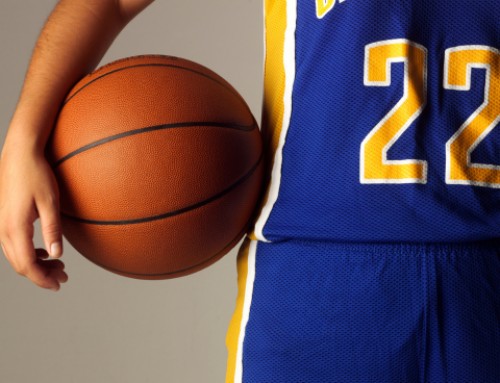
6’11” Average height of centers from the 2006-2007 final top 10 NCAA D-I basketball teams
6’8” Average height of centers from the 2006-2007 final top 10 NCAA D-III basketball teams
211 lbs. Average weight of PAC-10 starting quarterbacks in 2007
194 lbs. Average weight of Mid-American Conference starting quarterbacks in 2007
77 Percent of NCAA D-I student athletes who graduate within six years
Estimated Probability of Competing in Athletics Beyond High School, College*
|
Basketball (M)
|
Basketball (w)
|
Football | Baseball |
Hockey (M)
|
Soccer (M)
|
|
| Number of HS senior athletes |
156,096
|
129,408
|
306,227
|
134,477
|
10,361
|
102,553
|
| Number of NCAA freshman positions |
4,735
|
4,313
|
17,501
|
8,219
|
1,135
|
5,655
|
| Percentage of athletes who transition from HS to NCAA |
3%
|
3.3%
|
5.7%
|
6.1%
|
11%
|
5.5%
|
| Number of NCAA athletes drafted into a professional league, per year |
44
|
32
|
250
|
600
|
33
|
76
|
| Percentage of NCAA athletes who transition to a professional league |
1.2%
|
1%
|
1.8%
|
9.4%
|
3.7%
|
1.7%
|
| Percentage of HS athletes who eventually transition to a professional league |
.03%
|
.02%
|
.08%
|
.45%
|
.32%
|
.07%
|
+1200 Colleges, universities, conferences and non-profits that comprise the NCAA , which represents more than 380,000 student-athletes in 31 different championship sports
$1 billion Amount NCAA schools award in athletic scholarships each year
More than 126,000 student-athletes receive a partial or full scholarship
$33 billion Amount the federal government provides in grant aid for postsecondary education
1.7 million Number of students who take advantage of the 2,300 sources of college funding, which totals nearly $3 billion*
*Source: collegeboard.com
$1 million Potential earnings gap over a lifetime between someone with a high school diploma and someone with a college degree
RECOMMENDED FOR YOU


MOST POPULAR


Key Facts & Figures About Collegiate Play
$12,800 Average cost of one year at an in-state public school
$19,000 Average cost of one year at an out-of-state public school
$27,800 Average cost of one year at a private college
$10,500 Average cost of one year at a two-year community college
6’11” Average height of centers from the 2006-2007 final top 10 NCAA D-I basketball teams
6’8” Average height of centers from the 2006-2007 final top 10 NCAA D-III basketball teams
211 lbs. Average weight of PAC-10 starting quarterbacks in 2007
194 lbs. Average weight of Mid-American Conference starting quarterbacks in 2007
77 Percent of NCAA D-I student athletes who graduate within six years
Estimated Probability of Competing in Athletics Beyond High School, College*
|
Basketball (M)
|
Basketball (w)
|
Football | Baseball |
Hockey (M)
|
Soccer (M)
|
|
| Number of HS senior athletes |
156,096
|
129,408
|
306,227
|
134,477
|
10,361
|
102,553
|
| Number of NCAA freshman positions |
4,735
|
4,313
|
17,501
|
8,219
|
1,135
|
5,655
|
| Percentage of athletes who transition from HS to NCAA |
3%
|
3.3%
|
5.7%
|
6.1%
|
11%
|
5.5%
|
| Number of NCAA athletes drafted into a professional league, per year |
44
|
32
|
250
|
600
|
33
|
76
|
| Percentage of NCAA athletes who transition to a professional league |
1.2%
|
1%
|
1.8%
|
9.4%
|
3.7%
|
1.7%
|
| Percentage of HS athletes who eventually transition to a professional league |
.03%
|
.02%
|
.08%
|
.45%
|
.32%
|
.07%
|
+1200 Colleges, universities, conferences and non-profits that comprise the NCAA , which represents more than 380,000 student-athletes in 31 different championship sports
$1 billion Amount NCAA schools award in athletic scholarships each year
More than 126,000 student-athletes receive a partial or full scholarship
$33 billion Amount the federal government provides in grant aid for postsecondary education
1.7 million Number of students who take advantage of the 2,300 sources of college funding, which totals nearly $3 billion*
*Source: collegeboard.com
$1 million Potential earnings gap over a lifetime between someone with a high school diploma and someone with a college degree
RECOMMENDED FOR YOU
Create A Free Recruiting Profile Today!
CaptainU helps athletes & parents not only be proactive but also to manage and take control of their entire recruiting journey.